As more states open up for businesses with a resultant increase in consumers into the public, the news is instantly going to jump on any increase in rates of COVID. Fear sells. How do you decide if you should stay at home or head into the world? You ask questions.
What conclusion most media outlets quickly jump to is that they are confirming their bias that this virus is dangerous and we need to avoid it even more due to a correlation of increase in infections and businesses operating.
These conclusions are often reported in terms of percentages. If 50% of the workforce is allowed to go back to work and there’s a 50% increase in COVID infections, to the average person, this sounds like a 1 to 1 correlation.
It’s like when Michael Bloomberg was reported to spend $500 million on his election campaign, how many comments did you see that he should just pay every American $1 million instead? Seriously.
Something you have to examine deeper is the actual number versus the relative number. A 50% increase in COVID infections doesn’t mean all 50% of the increase in work force got infected. Say a company of 5,000 people allow 2,500 back to work, that’s 50% of the work force. Let’s say that specific company had 8 cases of COVID prior to lockdown and it increased by 50% with the return to work order, that’s 4 new cases, not 2,500 that got the infection. A 50% increase sounds a lot scarier and more catchy when reported. It’s how many drug benefits are reported.
Why would there be a correlation of increase in COVID cases with businesses going back to work and people getting out of their homes? There’s a bigger pool of people. Does this mean that COVID is that dangerous or just that wide spread? You have determine that for you. But make sure you’re consciously determining that for yourself and not just subconsciously absorbing it from surrounding sources.
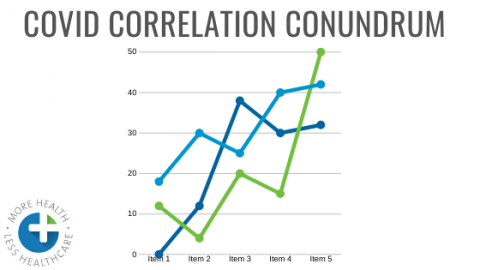
The pesky thing about correlation is that you can compare two totally different phenomena and create whatever conclusion you desire. These are how epidemiology studies are created and derived, usually with nutrition recommendations. There is no intervention nor control group, just observation of behaviors over a specified time. It’s pretty easy to make a conclusion on whatever you want. For example.
DIVORCE and MARGARINE CONSUMPTION
The divorce rate in Maine from 2002-2006 was highly correlated (99.26%) with the per capital consumption of margarine. Does this mean margarine causes divorce? As margarine consumption decreased, so did divorce. How many marriage therapists saw this and advised their couple clients to stop eating that rancid, trans-fat?
What other correlations could come out of this time frame of an increase in population being out and about but blamed on COVID?
Bee Stings. I’m not talking about the killer hornets. Hibernation is ending and pollination needs to happen. But is it because it’s spring time or because there is an increase COVID infections?
Pets Euthanized. Remember all those pets adopted when stay-at-home orders started? Now that people can leave their homes they will be returned to the pet shelters to wait the inevitable. COVID hates animals.
DUIs. COVID may be responsible for record numbers of DUIs. Bars will open. People will drink. People will drive. Damn COVID.
Disc Herniations. With gyms opening back up and people extremely deconditioned, the weekend warrior will want to get back into shape as fast as possible doing too much, too soon. If it weren’t for an increase in COVID infections, his spine wold be fine.
Drownings. Schools are letting out, beaches and back yard pools are opening and ‘due to COVID’ we have a correlated increase in drownings.
Bear attacks. Wild animals are getting used to having some space. The domesticated animals (humans) will start venturing out to national parks, camping, you name it. Wild animals meet domesticated animals and my money is on the wild animal…due to an increase in COVID infections.
Food Poisoning. Restaurants will start opening and as more people are dining in these establishments, food poisonings will increase due to the rush of patrons, sloppy procedures and inexperienced kitchen staff thus leaving you more susceptible to food poisoning due to COVID infections.
You get the picture. Name any activity that increases with the density of people gathered and put it in a time frame of when COVID infections increase, and you can create epidemiological conclusions that the ill effect of increases in that activity are due to rising COVID infections.
You can blame an increase in public mask wearing with an increase in COVID infections. You can blame an increase in COVID infections on use of disinfectants. You can blame an increase in COVID deaths with ventilator manufacturing.
Name 2 variables, and if they both rise or fall during your allotted time frame, you can create a correlative epidemiological study and support whatever side of the equation you want to be correct.
Ultimately beliefs dictate behaviors so I’ll re-iterate my point from above. Make sure you’re consciously determining that for yourself and not just subconsciously absorbing it from surrounding sources. Just keep asking yourself, ‘why do I believe that and examine from there.’


0 Comments